Evidence informs the conversation. It cannot predict the result for an individual home.
SCREEN 2 · THE EVENT AT A GLANCEWhat is Super Saturday?
The supplied 2027 vendor brochure describes a coordinated Boxing Day launch with the support of the McGrath network (page 2), and a planned Super Saturday auction day on 30 January (page 5). Your agent will confirm the campaign and auction arrangements for your property.
See the supplied campaign overview, p2 ↗SCREEN 3 · PRESS COLLAGE
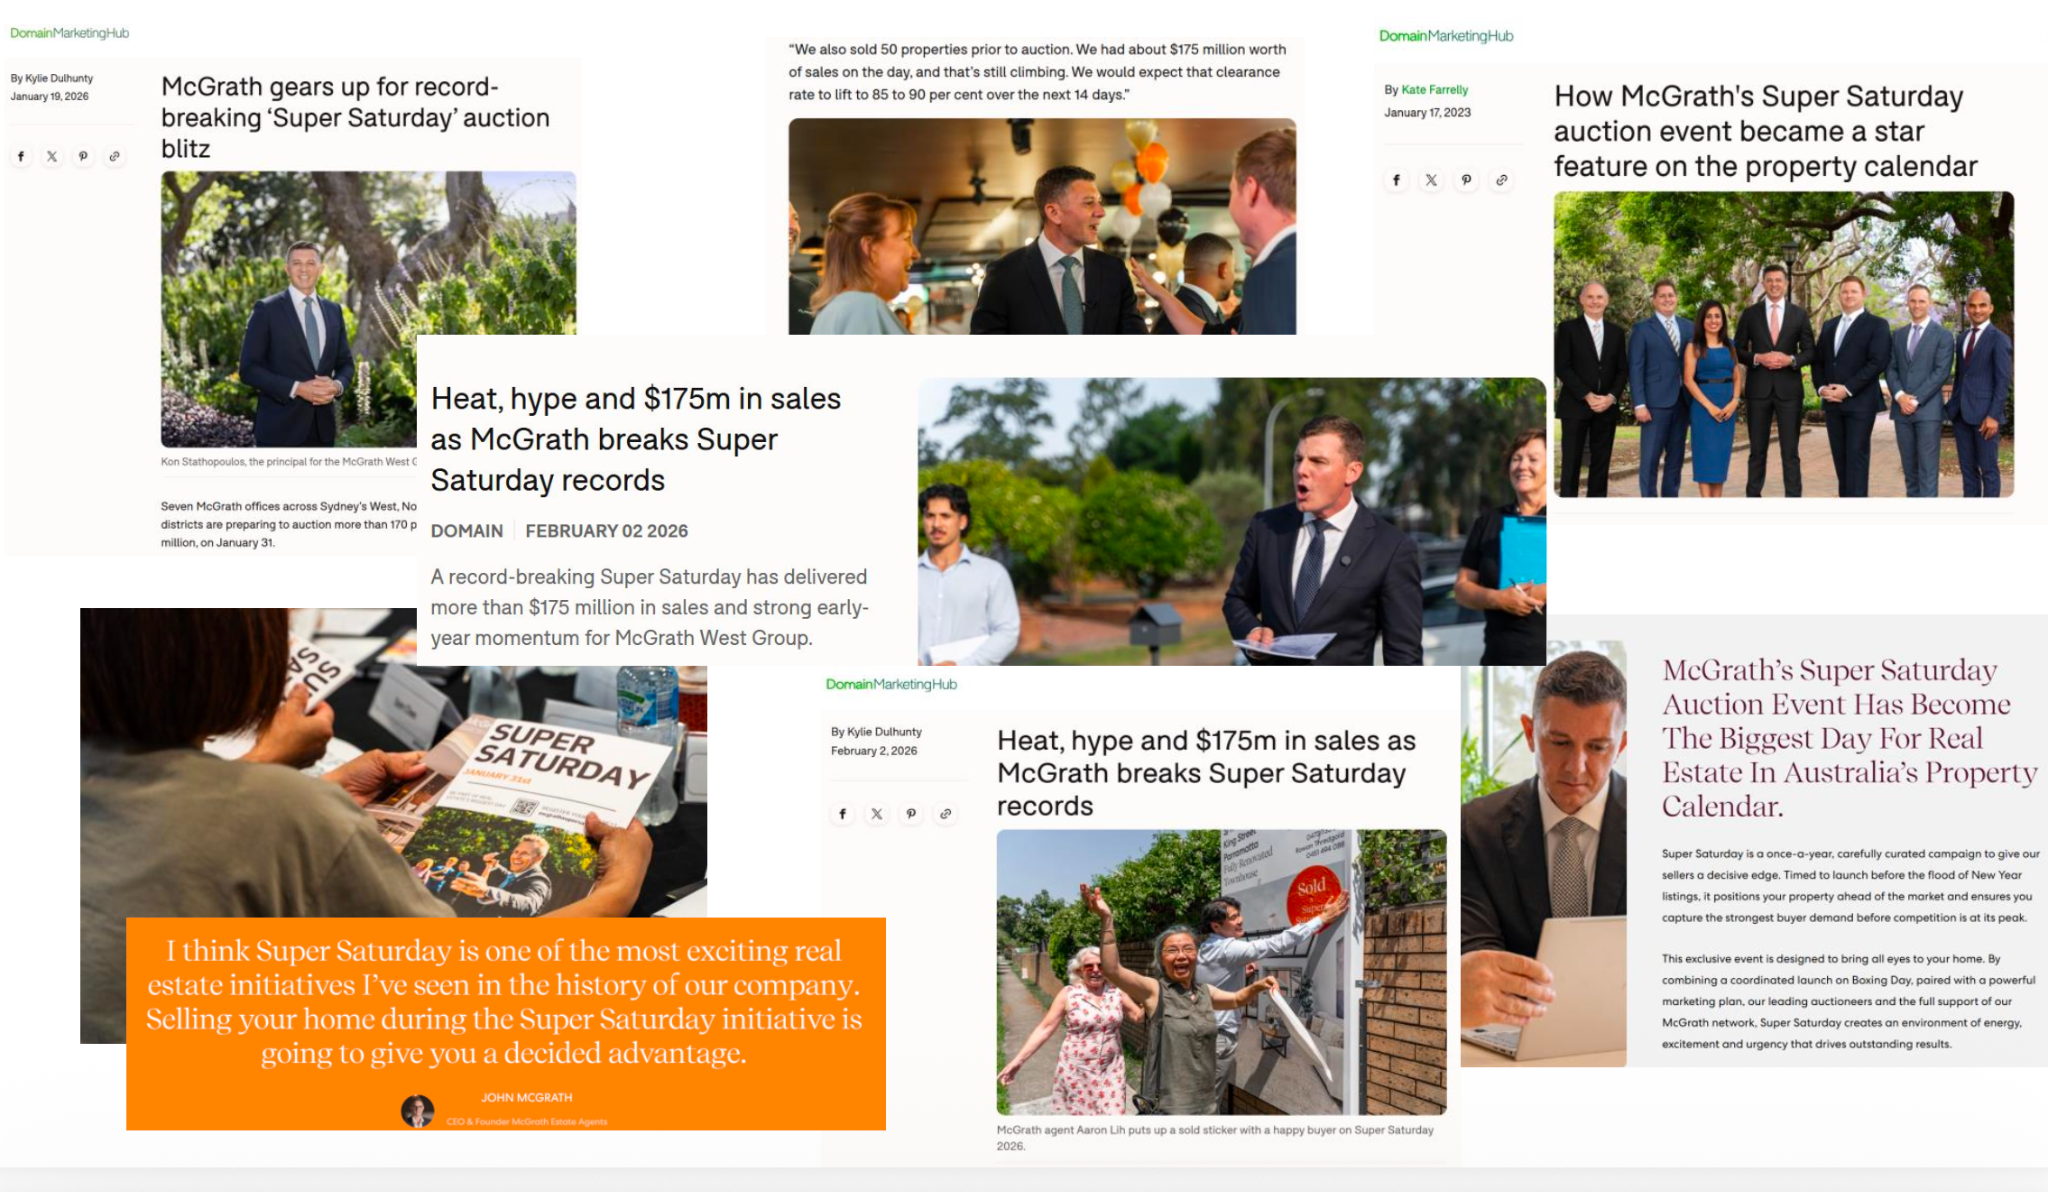
McGrath coverage and wider industry examples
The slide uses the press collage supplied for this presentation on 26 October 2026. It includes article extracts and photographs as supplied. The presentation does not add a separate article link overlay.
McGrath previews and campaign launches are labelled separately from early results and later updates. For example, the 2 February and 6 February 2026 articles report the same January event at different times. Their figures and campaign scope do not establish the counting basis of the supplied annual chart. They are not used to replace or verify that chart’s counts or rates.
SCREEN 4 · REPORTED EVENT HISTORYSuper Saturday results · 2021–2026
Source: the “Momentum built over time” chart supplied for this presentation on 22 October 2026, matching the supplied Agent hub event series. Bidders, auctions, sold counts and clearance rates are reproduced as supplied, not independently audited.
Supplied annual event figures| Year | Bidders | Auctions | Sold | Reported clearance |
|---|
| 2021 | 170 | 25 | 18 | 74% |
|---|
| 2022 | 225 | 62 | 55 | 89% |
|---|
| 2023 | 250 | 68 | 58 | 85% |
|---|
| 2024 | 315 | 120 | 95 | 79% |
|---|
| 2025 | 265 | 127 | 100 | 73% |
|---|
| 2026 | 220 | 170 | 135 | 78% |
|---|
The reported rates are not recalculated from these counts. Three years do not arithmetically reconcile: 2021 shows 18 ÷ 25 = 72%, compared with 74% reported; 2025 shows 100 ÷ 127 = 78.74%, compared with 73% reported; and 2026 shows 135 ÷ 170 = 79.41%, compared with 78% reported. The supplied chart does not explain the rate denominators, adjustments or sale cut-off. No alternative denominator or count is invented.
These historical results do not predict an individual property result or the 2027 event. The previously shown “Strong results. Clear context.” screen is retained as hidden content and is not part of the presentation navigation.
View the supplied event history chart ↗ARCHIVED EVIDENCE · TWO DISTINCT DATASETS78% reported clearance · Super Saturday 2026
Source: the “Previous results” chart supplied and confirmed as verified for 2026 by the presenter on 21 October 2026. The 2026 column shows a reported 78% clearance rate, 220 bidders, 170 auctions and 135 sold. The headline reproduces the supplied 78%; it is not a recalculated rate.
The counts and rate do not arithmetically reconcile: 135 ÷ 170 = 79.41%, rather than 78%. The chart does not explain the rate’s denominator or adjustment. No alternative count or denominator is invented, and the headline should be understood as source-reported. These supplied event results have not been independently audited.
The 2026 result replaces the earlier 2022 headline on this screen at the presenter’s request. It is historical event data, not a forecast for a property or the 2027 event.
View the supplied results chart ↗87% at 21 days · reported running auction clearance
The revised supplied sales report, confirmed as the accurate figures on 19 October 2026, contains a “Running Clearance Rate” table: On/Prior 74%; 7 Days 79%; 14 Days 85%; 21 Days 87%.
On/Prior 74%7 Days 79%14 Days 85%21 Days 87%
87% is the highest figure in that revised running series. It is not auction-day clearance, is not the 2026 Super Saturday event cohort and must not be calculated using the event’s counts.
The running table does not specify its cohort, denominator, calendar reporting period or exact post-auction counting methodology. The surrounding report has a January–September 2026 heading but FY27 labels in a separate count block. Those counts are not used to infer a denominator for this running series.
The revised table supersedes the earlier supplied wording “87% within 14 days”: the corrected table records 85% at 14 days and 87% at 21 days. The vendor brochure is a source for the event history and campaign dates, not for this revised running series.
No price premium, guaranteed outcome or forecast is inferred from either measure. Earlier 94% and 95% general-auction figures were superseded and are not used. The underlying report is supplied internal material, not independently audited.
SCREEN 5 · 2026 CALENDAR YEAR TO DATEAuction vs private treaty · McGrath comparison
Source: the comparison image supplied for this presentation on 21 October 2026. The user identified the reporting period as calendar year to date. The exact data cut-off date was not provided; the date supplied is not assumed to be the cut-off.
Auction: Clearance 74%; Days on Market 29; Auctions booked 439; Total Sold 325. Private treaty: List-to-sell ratio 51%; Days on Market 60; Properties listed 1073; Total Sold 547.
The supplied headline percentages reconcile to the counts after whole-number rounding: 325 ÷ 439 = 74.03%, reported as 74%; 547 ÷ 1073 = 50.98%, reported as 51%.
The source does not state whether Days on Market is a mean or median, or define the counting methodology, property mix and cohort boundaries. Auction clearance and private-treaty list-to-sell ratio are labelled separately and should not be treated as identical measures or proof that the sale method alone caused a result.
This calendar-year-to-date comparison is separate from the 2026 Super Saturday event results and the revised running-clearance series retained in these sources. It does not establish the denominator or reporting period for the 87% at 21 days. These are supplied internal results, not independently audited, and are not a forecast for your property.
View the supplied comparison image ↗STRATEGY COMPARISON · ILLUSTRATIVE CALENDAR
A scheduled auction and a historical illustration
The latest supplied slide reference compares a 26 December 2026 launch and a scheduled 30 January 2027 auction with an illustrative 60-day private-treaty campaign ending about 24 February. The 35 elapsed days from launch to auction are not the separate historical 29-day auction average shown in the statistics.
The supplied timing PDFs identify the 29 and 60 Days on Market figures as McGrath 2026 calendar-year-to-date averages, but do not provide an underlying dataset, sample size, geographical scope or exact cutoff. The 60-day rail is an illustration, not a forecast for a property. A scheduled auction is a decision point, not a guaranteed sale date.
The supplied slide reference shows the RBA decision on 9 February 2027 and the NSW election on 27 March 2027. These markers indicate potential uncertainty, not a prediction of rate rises or buyer behaviour. The shared date axis runs from 26 December 2026 to 27 March 2027: auction day 35, RBA decision day 45, illustrative private-treaty endpoint day 60 and election day 91. The private-treaty rail still ends at day 60, not at the election.
View the supplied timing visual (PDF) ↗RBA: official monetary-policy calendar ↗NSW Electoral Commission: 2027 state election ↗SCREEN 9 · EXCLUSIVE TECHNOLOGYOpenBook interactive demonstration
The buyer interface and agent activity behaviour are reused from the supplied OpenBook pitch-deck prototype. Explore property information, documents, location insights, prepared AI answers and simulated contact options. The agent panel shows the actions taken in the demonstration, not an inferred buyer-intent score.
This is a self-contained demonstration using captured listing information, local documents and prepared responses. It does not send messages, contact an agent, book an inspection, register a bidder, submit an offer, connect to a live CRM or invoke live AI. Activity is kept only in memory and can be cleared with Reset demo.
Captured property information, reports and maps are examples, not current advice for a transaction. The original provider disclaimers remain in the demonstration. Do not enter personal or sensitive information.
View the original OpenBook pitch demonstration ↗SCREEN 10 · ILLUSTRATIVE BUYER PROFILEFrom activity to a better conversation
This static dashboard is recreated from the supplied OpenBook buyer-profile mock-up for clear reading in a desktop preview. The supplied names, example.com contact details, activity, conversations, stages and figures are illustrative, not a live buyer record.
The sample “high intent” label and AI summary are examples of the interface, not validated predictions. Activity can help an agent ask better questions; it cannot reveal a buyer’s private thoughts or guarantee a bid. More informed conversations support buyers to make their own decisions.
The preview has no CRM connection, live scoring, messaging, registration or refresh action. Its only working controls scroll the demonstration. The original supplied image is retained below.
View the supplied dashboard mock-up ↗SCREEN 6 · DOMAIN TIMING EVIDENCE
A planned campaign informed by historical attention and stock
The supplied 19-page Domain presentation, pages 6 and 8–10, is the primary source. Page 6 charts weekly online views across 2025–26. Page 8 explicitly labels monthly listings as calendar-year 2025 for Western Sydney, Hills and Northern Suburbs. These are different reference periods, not one synchronized dataset.
The weekly views chart labels the week of 22 December 2025 at 2,767.36K and the final January bar at 5,547.82K. That final bar corresponds to 26 January 2026 from weekly spacing. The ratio is approximately 2.0047, displayed as ≈2×. The slide rounds the endpoints to 2.77M and 5.55M. The six successive displayed values are 2,767.36K, 3,549.89K, 4,041.20K, 4,860.60K, 5,160.51K and 5,547.82K. The native chart reproduces the supplied cropped scale, with precise interactive values recovered from the original Domain chart.
Page 6 does not print a geographic scope. The separate supplied seasonal visual attributes the views to Western Sydney, Hills and Northern Suburbs, but the original weekly chart does not independently confirm that scope. Online views are not distinct buyers, enquiries, sales or views per listing.
Page 8 shows January 5.90K and February 7.15K listings. February is approximately 21.2% above January, shown as +21%; the original slide narrative rounds this to 20%. The supplied seasonal visual uses cropped axes. Pages 9–10 separately report January as the strongest 2025 month for views and enquiries per listing; those measures are not merged with weekly views.
The separate one-page seasonal visual describes weekly views as October 2025–April 2026, and reorders calendar-year 2025 listing months to illustrate seasonality. Its cropped axes are reproduced as supplied: views from 2.5M and listings from 5,500. The planned 26 December 2026 launch and 30 January 2027 auction are shown separately from the historical charts. The historical data is not a 2027 forecast and does not establish that this timing guarantees more buyers, a higher price or a sale.
Domain weekly views, p6 (PDF) ↗Domain listings, p8 (PDF) ↗Supplied seasonal visual (PDF) ↗SCREEN 7 · PLANNED TIMELINESuper Saturday 2027
The supplied 2027 vendor brochure, page 5, outlines an online launch on 26 December, a portal refresh on 8 January, first open home on 9 January, strategy and reserve discussions in the week of 25 January, and auction on 30 January.
The presentation shows key milestones, not every campaign task. This is a planned schedule, not a booking or commitment. Confirm your property’s dates, advertising inclusions, fees and readiness with your agent. No claim of fewer competing listings, more buyers or future interest-rate movements is made here.
See the planned campaign, p5 ↗SCREEN 12 · YOUR CHOICESNSW auction and agency guidance
NSW Government guidance covers the reserve price, bidding, passed-in properties and binding auction sales. Your agency agreement should set out services, fees, expenses and the agent’s authority.
This is a general guide for NSW property, not advice on your particular contract. Ask your solicitor or conveyancer to explain your obligations, settlement arrangements and any decision to accept an offer.
NSW: buying property at auction ↗NSW: agency agreements ↗The vendor brochure is retained as supplied. This presentation uses the specifically identified dates and results with the context above; broader claims in the brochure have not been independently verified.
 SUPER SATURDAY 2027